Measure the body
Collect 3D surface scans, standard anthropometry, and anatomical landmarks across a wide range of body characteristics.

University of Michigan · HumanShape Research
From three-dimensional body scans to statistical models that describe how people vary.
University of Michigan Transportation Research Institute
 3D anthropometry
01 / Methodology
HumanShape combines carefully collected 3D scans, anatomical correspondence, and statistical analysis to generate body shapes from a small set of measurements.
Collect 3D surface scans, standard anthropometry, and anatomical landmarks across a wide range of body characteristics.
Align landmarks, then fit the surface. Corresponding vertices represent the same anatomical locations across scans.
Use principal component analysis to represent the major patterns of variation in body geometry and measurements.
Relate those patterns to predictors such as stature, body mass index, and the ratio of sitting height to stature.
The online body shape models are based on three-dimensional anthropometric measurements of people with a wide range of ages and body characteristics. Scanning systems, including VITUS XXL and depth cameras, capture body contours and standard dimensions. A FaroArm 3D digitizer records anatomical landmarks used to estimate kinematic joint locations. Research staff collect and validate the measurements.
Scan data are standardized by fitting a HumanShape template. Vertex density varies by body segment to represent local geometry efficiently while maintaining anatomical correspondence.
The two-level fitting method (Park and Reed, 2015) first uses a radial basis function to morph the template to the target landmarks. An implicit surface fitting step then captures the geometric detail of the target scan.
Following Reed and Parkinson (2008), template vertex coordinates are flattened into a geometry vector for each participant. Standard anthropometric measurements, anatomical landmarks, and estimated joint-center coordinates are included in the analysis.
Principal component analysis (PCA) reduces dimensionality while retaining variation in the data. The first 100 principal component scores are generally retained for the models.
Linear regression relates those scores to participant characteristics: stature, body mass index (body mass in kilograms divided by stature in meters squared), and the ratio of erect sitting height to stature. The related publications describe the methods in more detail.
02 / Subject pools
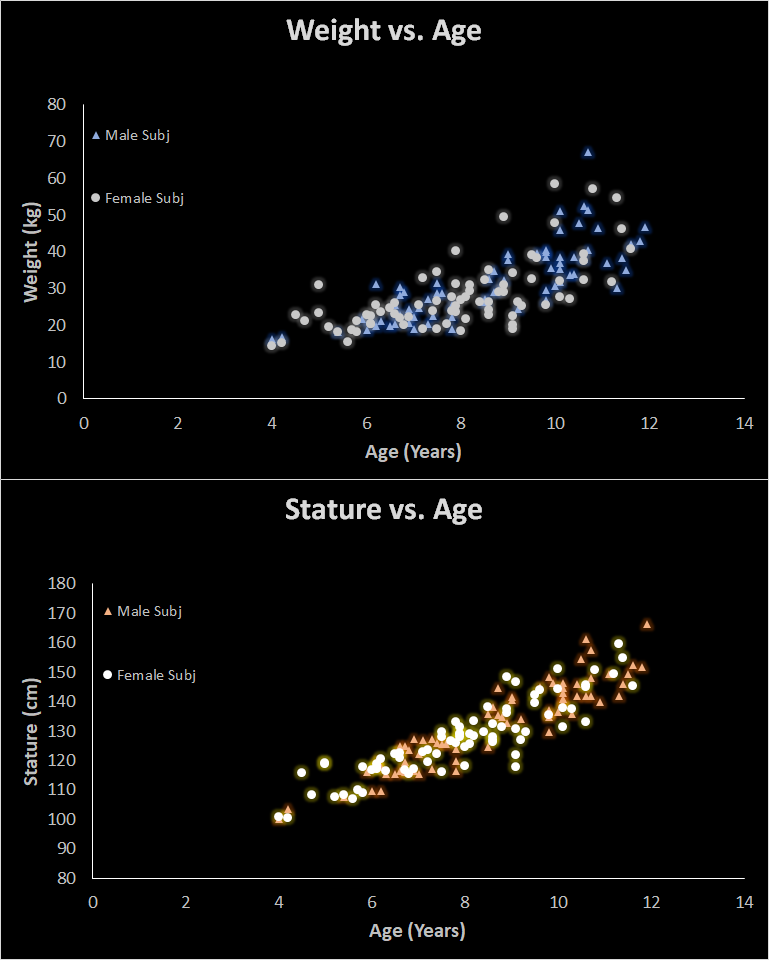
Explore the body mass and stature distributions of the participants used to develop the child, adult, and toddler models.
Body mass and stature plotted against age for the child subject pool. The original figures distinguish male and female participants.
03 / Applications
Statistical body shape models connect human variability to design and simulation. The research supports demonstrated methods and potential applications across several fields.
Represent body-size variation in seating and product design. Potential uses include clothing-fit simulation and evaluating protective equipment across a broader range of body forms.
Inform anthropometric specifications for human surrogates, including crash test dummies and finite-element models, using a few target body dimensions.
Generate custom avatars from low-resolution depth-camera data and predict standard anthropometry. Parametric models can also be integrated into ergonomics software.
Legacy research demonstrations · Model, landmark, and measurement downloads are unavailable.
04 / Related publications
7 publications · Journal articles & conference papers
Ergonomics · 65(6):795–803 · DOI: 10.1080/00140139.2021.1992020
Applied Ergonomics · 90:103239 · DOI: 10.1016/j.apergo.2020.103239
Traffic Injury Prevention · 18(5):533–536 · DOI: 10.1080/15389588.2016.1269173
Ergonomics · 58(2):301–309 · DOI: 10.1080/00140139.2014.965754
3rd International Digital Human Modeling Conference · Tokyo, Japan
3rd International Digital Human Modeling Conference · Tokyo, Japan · PDF
ASME International Design Engineering Technical Conferences and Computers and Information in Engineering Conference · pp. 561–569